

Most algorithms for retrieving algal biomass are based on estimates of chlorophyll a concentrations (ugr/L), as determined from reflectance bands or indices obtained using optical sensors.
CURRENT SUGGESTION FOR WALES:
- The Surface Algal Bloom Index (SABI) for Landsat, Sentinel-2 and the Rededge Micasense (drone-mounted) (for chloropyll a primarily)
- A two band model (TWM; red and near infrared) for retrieving chlorophyll a concentration.
- A three band model (TBM) for Landsat and Sentinel-2.
- The blue and green channels to define two ranges of Chlorophyll a (Rededge Micasense only).
Further details can be found in Castro et al. (2020).
The Surface Algal Bloom Index (SABI) can be calculated using a) the Landsat Operational Land Imager (OLI) and (B5-B4)/(B2+B3), b) the Sentinel-2 Multi-Spectral Imagery (B8A-B4)/(B2+B3) and also c) the Rededge Micasense (B4-B3)/(B1+B2), which is a drone-based sensor.

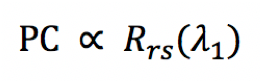
Optimal band ratio modelling (OBM) primarily uses the absorption trough or scattering peak of a pigment of interest. The optimal band ratio needs to be determined specifically for each water body where a correlation is obtained (Gitelson et al. 2008)
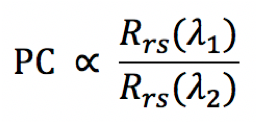
Two-band models (TWM) utilise the PC absorption at two different wavelengths λ1 and λ2. λ1 represents the PC absorption band and λ2 the PC fluorescence band. To predict PC, Schalles and Yacobi (2000) proposed wavelengths 625 and 650 for λ1 and λ2 respectively. Simis et al. (2005) proposed the wavelengths 709 (Near infrared – NIR) and 625 for λ1 and λ2 respectively.
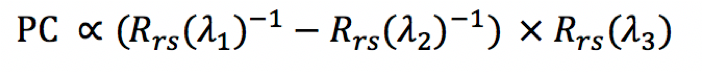
Three-band models (TBM) have been developed for Chl-a estimation from both vegetation and turbid inland waters but its effectiveness has been shown by Hunter et al. (2008). λ1 is selected to be in the spectral region so that Rrs(λ1) is maximally sensitive to specific pigment absorption (aph), λ2 in the spectral region such that Rrs (λ2) is minimally sensitive to aph, and simultaneously absorptions of other constituents are almost equal to that at λ1. As a result, Rrs(λ1) − Rrs(λ2) is associated with aph(λ1). However, this expression is still affected by the backscattering bb. A third band is required to accommodate the backscattering bb where a(λ3)≈aw and a(λ3)≪bb (Gitelson et al., 2008). The wavelength selection for the three bands is commonly carried out by an iteration process, which has been detailed in Gitelson et al. (2008).
References
Schalles, J. F., & Yacobi, Y. Z. (2000). Remote detection and seasonal patterns of phycocyanin, carotenoid and chlorophyll pigments in eutrophic waters. Ergebnisse Der Limnologie, 55(October), 153–168.